Tennessee Poll: Tennesseans generally support access to reproductive, abortion care services for women
The most recent Tennessee Poll by East Tennessee State University reveals that 91% of Tennesseans support the continued legalization of in-vitro fertilization (IVF), and 61% believe that a range of safe, effective and affordable methods of abortion care should be available to women.
This public support comes at a time when reproductive rights are being increasingly scrutinized following the Supreme Court's decision to overturn Roe v. Wade. Tennessee now has one of the nation's most restrictive abortion bans, allowing abortion only when the life of the pregnant person is at risk or the fetus is deemed nonviable. Despite these legal developments, the data shows that Tennesseans widely support both IVF and access to abortion care, signaling a disconnect between public opinion and current legislation.
The poll, which surveyed 701 Tennesseans from July 10-17, included questions on topics related to health, education and quality of life. As shown in the first press release on Sept. 20, Tennesseans report health care (including women’s health) as one of the top three problems facing the state at this time. To dive into this topic a little further, the poll specifically asked questions regarding access to in-vitro fertilization (IVF), access to safe and affordable abortion care, voting choices based on candidates’ stances on abortion and whether a person should go to jail or be arrested for seeking an abortion or helping their partner seek an abortion.
Reproductive health access
In-vitro fertilization (IVF). Overall, 91% of Tennesseans support the continued legalization of in-vitro fertilization. When this support is broken down demographically, there is a statistically significant difference (p = .003) in support for continued legalization of IVF between women (94%) and men (87%). Respondents who are older than 45 years of age, hold a bachelor’s degree or higher, or have a higher level of income show some of the strongest support for the continued legalization of IVF. These demographics are also consistent with individuals who have the highest rate of access to IVF services, which may explain this pattern of support.1,2 See figure 1.
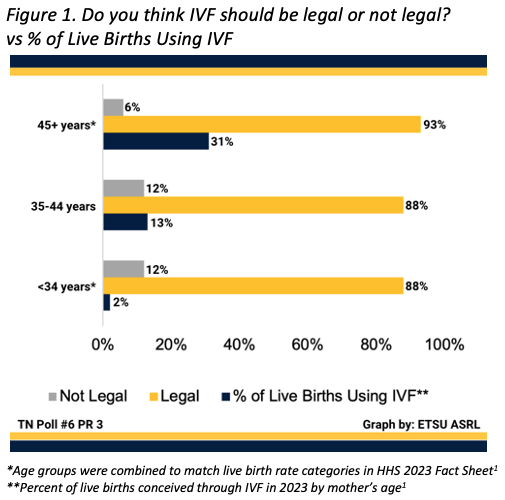
When it comes to opposition to the legal status of IVF, men who report a Conservative (15%) or Moderate (12%) political ideology are significantly more likely to oppose continued legalization of IVF (p = .029) than all other ideology and gender combinations. Overall, Liberal-identifying men (95%) are more supportive of continued legalization of IVF compared to Conservative identifying men (85%), and Moderate-identifying women (95%) are more supportive of continued legalization of IVF compared to Liberal identifying women (93%). In terms of political alignment, Democrats and those who lean Democratic (96%) show the strongest support for the continued legalization of IVF, followed by Republicans or respondents leaning Republican (90%), and Independents (85%).
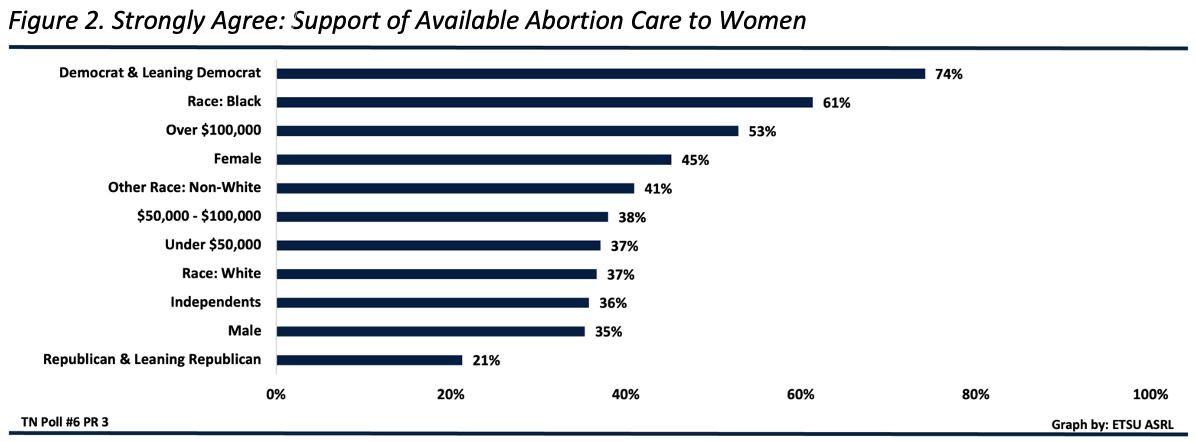
Access to safe and affordable abortion care. The majority of Tennesseans strongly agree (41%) or agree (20%) that a range of safe, effective and affordable methods of abortion care should be available to women in their communities. Of the 61% who strongly agree or agree, the highest level of support can be found among Democrats or respondents leaning Democrat (92%), respondents who earn more than $100,000 per year (67%), baby boomers (66%), respondents who hold a bachelor’s degree or higher (63%), women (62%), and residents of Middle and West Tennessee (64%, respectively). There is also a strong level of support across all racial groups, with Black respondents (80%) and other non-White respondents (73%) showing the highest support compared to White respondents (56%). See figure 2.
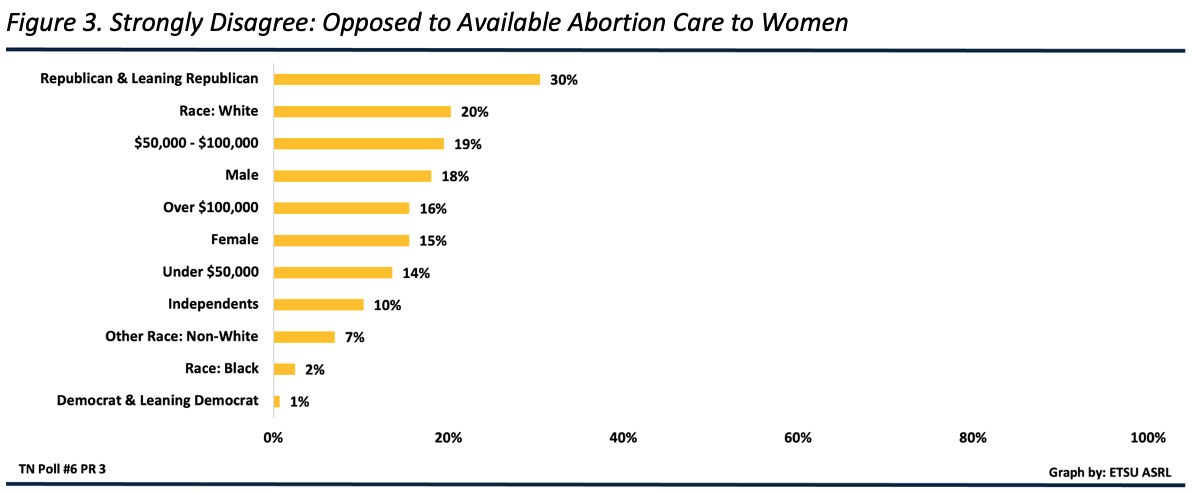
Only 25% of Tennesseans overall either disagree (8%) or strongly disagree (17%) that women should have access to abortion services. Most Conservative women (57%) either disagree or strongly disagree that women should have access to these services – significantly higher disagreement than all other ideology and gender combinations, including Conservative men, of whom only 40% feel this way. See figure 3.
Abortion attitudes and beliefs
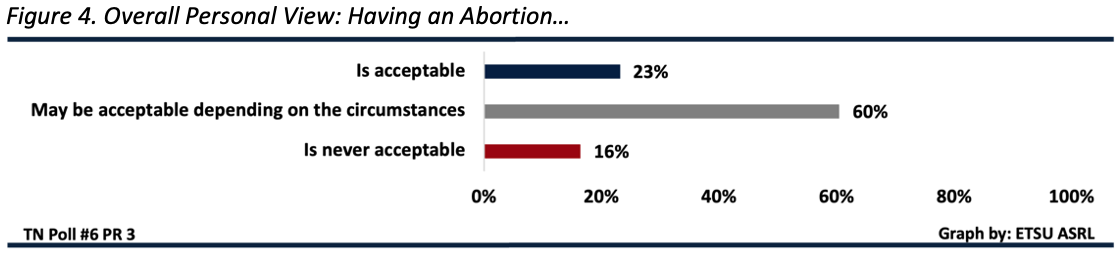
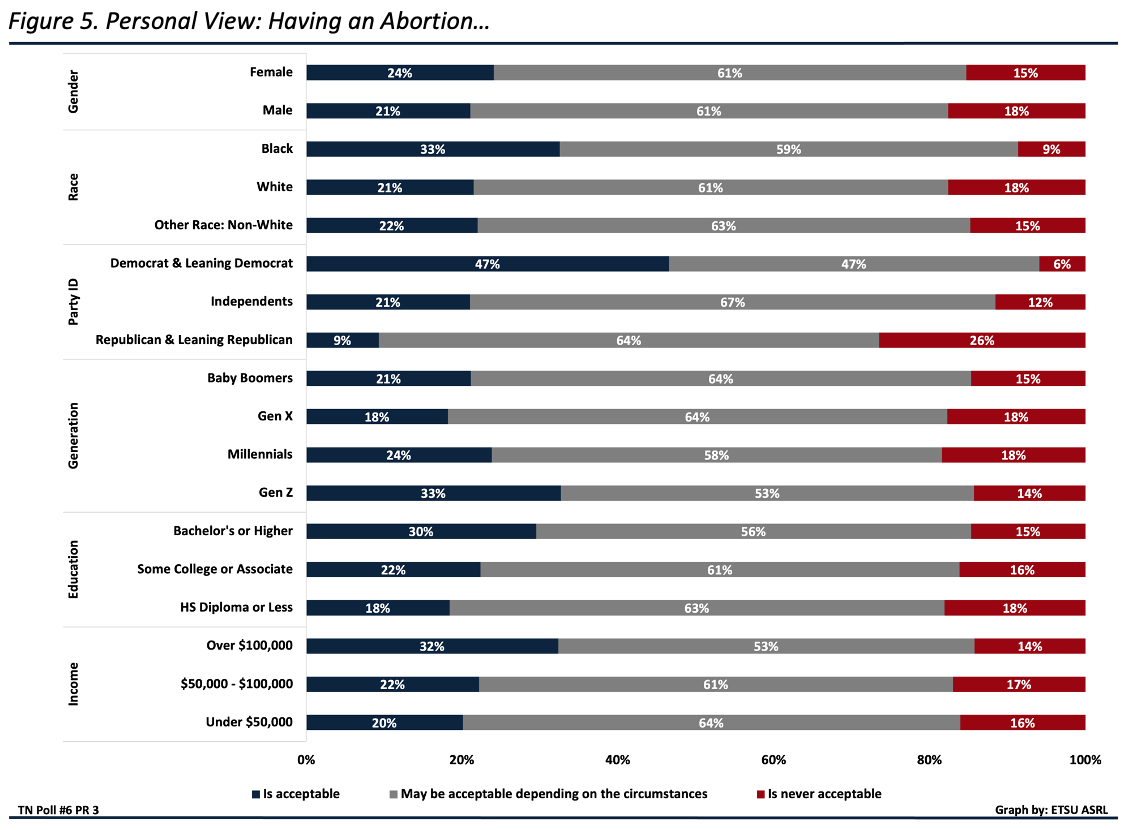
Personal views. Tennesseans were asked whether they felt abortion is always acceptable, may be acceptable depending on the circumstances or never acceptable. The vast majority (83%) felt abortion is either always acceptable (23%) or acceptable depending on the circumstances (60%). See figures 4-5. Republicans or those leaning Republican had the lowest level of any support for abortion access (73%). This group also had the highest percentage of respondents who felt abortion is never acceptable (26%), compared to only 6% of Democrats or those leaning Democrat. In contrast, Democrats or those leaning Democrat and Black respondents showed the highest levels of support for abortion, with more than 90% finding it acceptable.
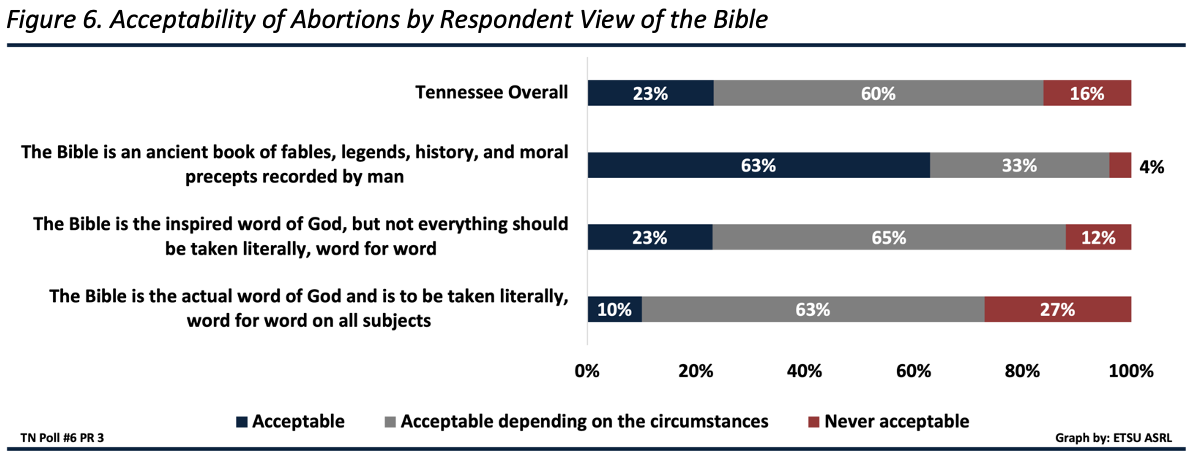
Abortion has been a significant issue for many Americans, particularly since the overturning of Roe v. Wade, with strong attention from anti-abortion and religious groups. Because of this, ASRL looked at how a respondent’s view of the Bible maps to their views on abortion acceptability. In The Tennessee Poll, we ask respondents how they interpret the Bible — whether they believe it is the literal word of God to be followed exactly, the inspired word of God but not to be taken literally in every instance, or a book of fables. This question helps gauge how strictly respondents adhere to a literal interpretation of their religious doctrine, and for our purposes, the extent to which this may or may not impact their views on other issues.
Despite their views on the Bible, the majority of Tennesseans feel that abortion is acceptable in some circumstances (83%). However, individuals who interpret the Bible less literally are more likely to believe that abortion is acceptable in any circumstance: 63% of those who see the Bible as fable, 23% of those who believe not everything should be taken literally, and 10% of those who view the Bible literally. Those who view the Bible in a literal context are significantly more likely to say that abortion is never acceptable (27%) compared to 12% of those who believe not everything should be taken literally and 4% of those who view the Bible as fable. See figure 6.
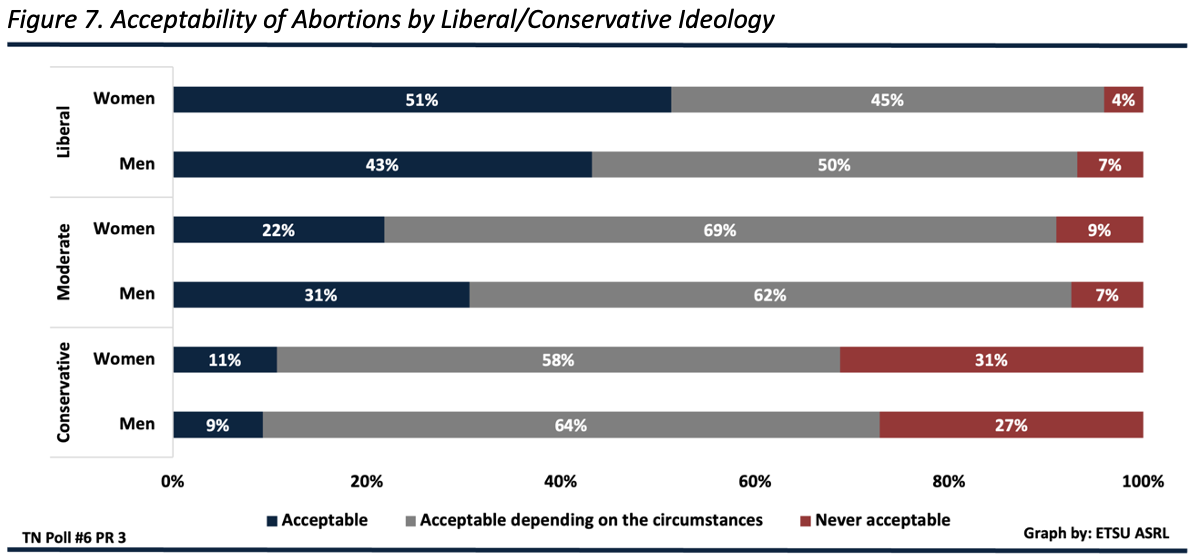
In addition to biblical literalism, there is a statistically significant difference regarding views on the acceptability of abortion by gender and political ideology. For most gender and ideology combinations, abortion acceptability depends on the circumstances compared to those who feel it is always acceptable or not at all acceptable. The only group that does not follow this trend is Liberal women, who felt abortion is more often always acceptable (51%) in comparison to other views (some circumstance – 45% and not at all – 4%). See figure 7. Consistent with their view on women being able to access abortion services, Conservative women more often view abortion as not acceptable (31%) in comparison to other groups, again, even more often than Conservative men (27%).
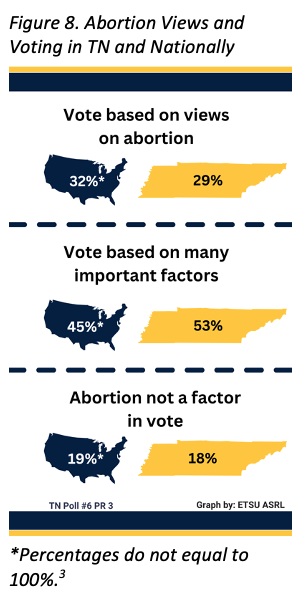
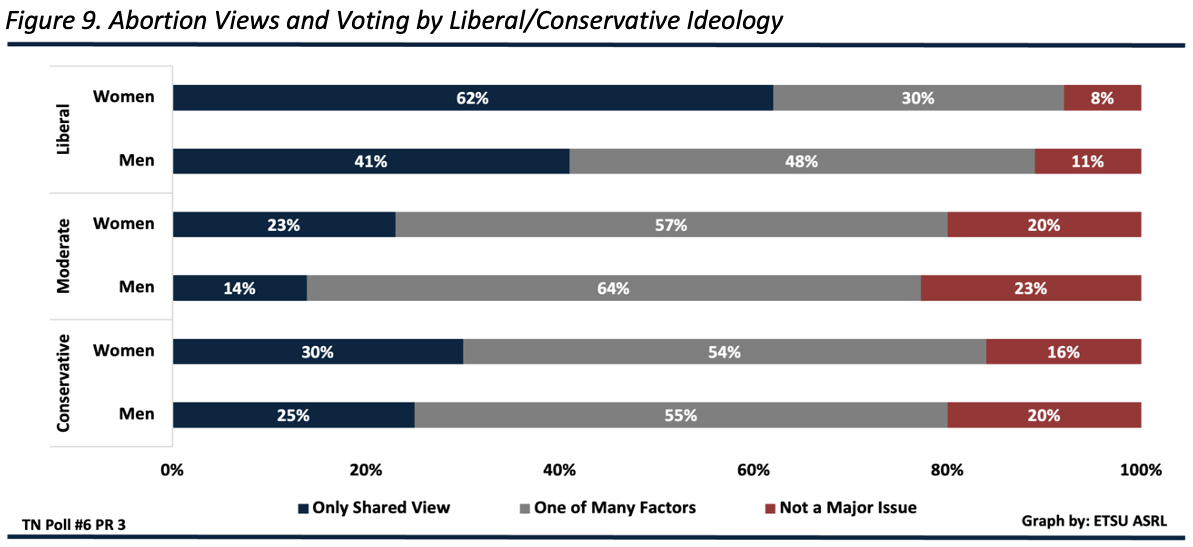
Voting and abortion policies. Respondents were asked whether they would only vote for candidates who shared their views on abortion, whether it would be one of many topics they would consider, or whether candidates’ stances on abortion would not be a major issue. Most Tennesseans said it would only be one of many factors they consider when voting (53%). Nearly one in three Tennesseans reported they would only vote for candidates with their same views on abortion (29%), with even fewer not considering the topic in their voting plans (18%). This follows a similar national trend discussed by the Gallup Poll in June 2024.3 See figure 8.
Tennesseans who would only vote for candidates with their same views on abortion included Democrat or those leaning Democrat (43%), women (34%), and those who view the Bible as fable (40%) compared to Independents (23%), men (23%) and those who feel not everything in the Bible should be taken literally (24%). When genders were analyzed by different political ideologies, voting for a candidate who shares their views on abortion was most significant for Liberal Tennesseans, but more so for Liberal women (62%) compared to Liberal men (41%). Moderate Tennesseans across genders were significantly more likely to say that it is not an issue for them in their vote (23% Moderate men and 20% Moderate women). Conservatives and Moderates were more likely than Liberals to say it would only be one of many issues they would consider. See figure 9.
People should not go to jail for accessing abortion services
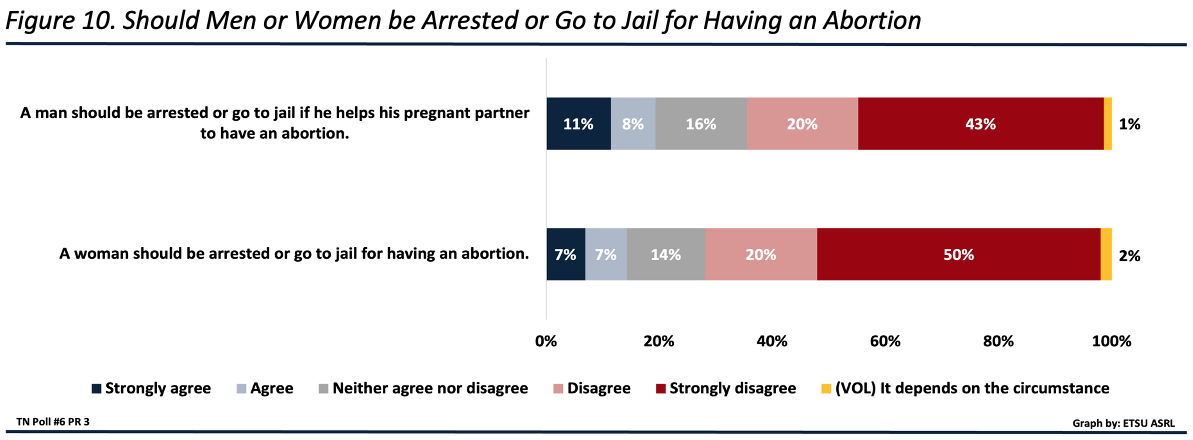
The poll asked Tennesseans whether a woman should go to jail for seeking abortion services and whether a man should be penalized for assisting her. Most Tennesseans either strongly disagreed or disagreed with the idea of arresting either a woman or a man in these circumstances; however, they were more opposed to penalizing women (70%) than men (63%). Among those who supported arresting individuals for accessing these services, 19% favored arresting a man for helping a woman, while 14% supported arresting a woman for seeking those services. When analyzed by gender and political ideology, Conservative men and women were also more likely to agree on arresting men instead of women. See figure 10.
References:
1. U.S. Health and Human Services (2024). Fact Sheet: In Vitro Fertilization Use
Across the United States. https://www.hhs.gov/about/news/2024/03/13/fact-sheet-in-vitro-fertilization-ivf-use-across-united-states.html.
2. Livingston G. (2018). A third of U.S. adults say they have used fertility treatments
or know someone who has. https://www.pewresearch.org/short-reads/2018/07/17/a-third-of-u-s-adults-say-they-have-used-fertility-treatments-or-know-someone-who-has/.
3. Gallup © (2024). Record Share of U.S. Electorate Is Pro-Choice and Voting on
It. https://news.gallup.com/poll/645836/record-share-electorate-pro-choice-voting.aspx.
This is the third in a series of data releases from The Tennessee Poll. We provide methodological information, margin of error estimates, as well as detailed tables with analysis on each question by different demographic categories. To find these, or to be added to our distribution list, go to etsu.edu/tnpoll. Graphics are provided for press use.
Important Notes:
This press release was originally due to be released on Oct. 11. Due to the devastating impact of Hurricane Helene on our community, we delayed the release series. We at the Applied Social Research Lab ask that you keep our impacted Tennessee, North Carolina and Virginia communities in your thoughts. The toll on our communities has been profound, and your support can make a difference. To learn how you can help, visit the ETSU Response page, “Bucs Rebuild Together.”
About the Tennessee Poll
The Tennessee Poll is conducted by the Applied Social Research Lab (ASRL) in the Department of Sociology and Anthropology at East Tennessee State University. ASRL is directed by Dr. Kelly N. Foster, professor of sociology.
The Tennessee Poll is an annual public opinion poll funded by ETSU. The mission of The Tennessee Poll is to provide the citizens and governance of Tennessee with neutral, unbiased information on Tennesseans’ perceptions of issues that impact their health, education, and quality of life.
Though the project has been internally funded to date, there exists the possibility of outside researchers or organizations being given the option to purchase space for questions on future polls. Should this occur, any and all funding sources will be noted in the methodology report for that particular poll.
The Applied Social Research Lab is a member of the Association of Academic Survey Research Organizations (AASRO) and adheres to the reporting requirements of the American Association for Public Opinion Research Transparency Initiative standards in research reporting.
For detailed information on The Tennessee Poll, including methodology and additional analysis, visit etsu.edu/tnpoll.
About the Authors
This press release was prepared by M. Rebecca Strasser, Ms. Morgan Kidd, Dr. Kelly N. Foster and Dr. Candace Bright Hall-Wurst. Graphics prepared by Ms. Morgan Jones Kidd and M. Rebecca Strasser. For information and biographies on the contributors to this release, see etsu.edu/asrl.
These questions were the product of a collaborative process with our colleagues in the College of Public Health at ETSU. We wish to acknowledge and thank Drs. Kate Beatty and Mike Smith and Ms. Jordan DeJong for their help in designing the questions included in this module as well as the initial analysis of the poll findings.
East Tennessee State University was founded in 1911 with a singular mission: to improve the quality of life for people in the region and beyond. Through its world-class health sciences programs and interprofessional approach to health care education, ETSU is a highly respected leader in rural health research and practices. The university also boasts nationally ranked programs in the arts, technology, computing, and media studies. ETSU serves approximately 14,000 students each year and is ranked among the top 10 percent of colleges in the nation for students graduating with the least amount of debt.
Stay in Touch
Follow ETSU on Social